Contour map generator: topographic line art of any place.
Choose an area and Printed Canyon draws its terrain as contour lines, ready to print. Set the interval, labels and colors, then download PNG, PDF or SVG.
Pay what you want. Digital files. No account.
Make a contour map in four steps
- Step 1
Choose the area
Search for a place, enter coordinates, pick a US state or start from a famous place. Upload a GPX file instead to draw your route over the contours.
- Step 2
Pick Contours
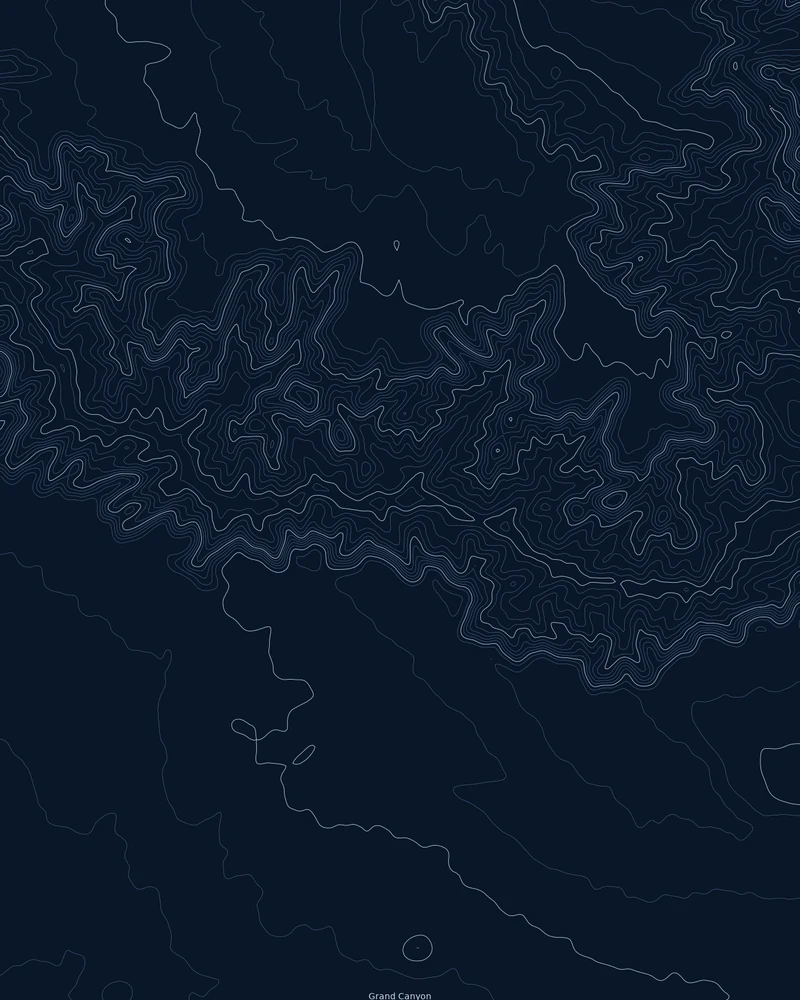
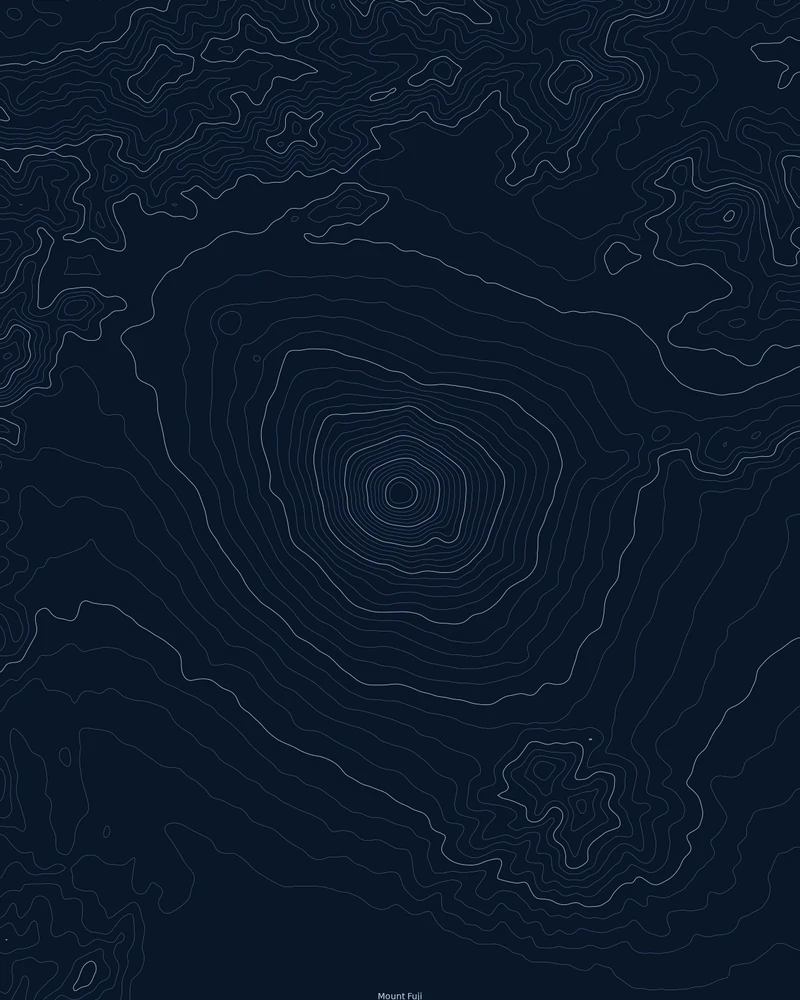
Choose the Contours poster style. The preview fills the frame with contour lines generated from the elevation data for your area.
- Step 3
Tune the lines
Keep Auto Interval or set a Contour Interval in meters, choose how often a bold index line appears, turn elevation labels on or off, and set the colors, line widths and title.
- Step 4
Download
Generate the poster and download PNG, PDF and SVG at 12 × 16, 18 × 24 or 24 × 36 inches. Name your price at checkout; $0 is accepted.
Art-style contours, not survey data
Each line joins points of equal elevation, drawn from public elevation data: USGS 3DEP in the United States where available, and Copernicus GLO-30 elsewhere. Closely spaced lines mean steep ground; widely spaced lines mean gentle slopes.
The generator is built for wall art. The elevation grid is resampled and smoothed so lines stay clean at print size, which also rounds off small details. The files are images and vector drawings, not GIS layers, and they are not suitable for navigation, engineering or property boundaries.
Want elevation as color bands or stacked profiles instead? The creator also offers Strata and Ridgeline posters, and 3D terrain models of the same area.
PNG, PDF or SVG: which file to use
Every contour map download includes all three files.
- PNG
- A high-resolution image for printing at home, at a print shop or on a photo service.
- A print-ready document at the poster size you chose.
- SVG
- Vector contour lines you can recolor or edit in Illustrator, Inkscape or Figma, or send to a cutter or plotter.
Choosing a contour interval
The contour interval is the height difference between neighboring lines. A small interval adds lines and shows gentle terrain in detail; a large interval calms busy mountains. Auto Interval picks a value for the elevation range of your area, so a state and a single peak both get a readable number of lines.
Index Interval makes every Nth line bold, like the index contours on a printed topographic map. With Show Labels on, those bold lines carry their elevation in meters.
Contour map generator questions
Is the contour map generator free?
You can download for $0. Printed Canyon is pay what you want, so paying is optional, and you do not need an account.
Are these survey-grade contours?
No. The contours are artwork. Elevation is resampled and smoothed so the lines print cleanly, and there is no GIS export such as shapefile, GeoJSON or DXF. Use official topographic maps for navigation, engineering or property work.
What contour interval does it use?
By default the interval is chosen automatically, a round number of meters that draws about 40 lines across the elevation range of your area. Turn off Auto Interval to set any interval from 1 to 200 meters.
Can I make a topographic map of a whole state?
Yes. Pick any US state and the contours are clipped to its outline. For anywhere else, search a place or enter coordinates and the map covers a rectangular area.
Can I make a 3D topographic map instead?
Yes. The same area can become a 3D-printable terrain model. Choose 3D Terrain Model in the creator and download STL or 3MF.
Have a recorded hike? Use GPX to poster to put your route on the map. Or browse states and famous places that open with a style already chosen.